Screen Shot 2015-07-07 at 12.05.29 PM

Recently I have discovered a really cool d3.js plugin called cola.js, which is a port of some carefully written code in C++ that handles adaptive diagrams.  Using this will allow me to easily plot constrained graphs in a web browser.  I think it would have taken me forever to write something that can work this well.  I wanted to be able to draw graphs as a debugging tool, and also as a visual aid when working on neural network architectures that can be evolved, so this seems to be the right tool.

After some hacking around, I was able to write a simple graph in .json format and have it plot on a live webpage.


{
    "nodes":[
      {"name":"0"},
      {"name":"1"},
      {"name":"2"},
      {"name":"3"},
      {"name":"4"},
      {"name":"5"},
      {"name":"6"},
      {"name":"7"},
      {"name":"8"}
    ],
    "links":[
      {"source":0,"target":6},
      {"source":1,"target":7},
      {"source":0,"target":2},
      {"source":2,"target":6},
      {"source":2,"target":8},
      {"source":2,"target":3},
      {"source":7,"target":3},
      {"source":3,"target":8},
      {"source":1,"target":3},
      {"source":0,"target":4},
      {"source":1,"target":4},
      {"source":0,"target":5},
      {"source":1,"target":5},
      {"source":4,"target":8},
      {"source":4,"target":5},
      {"source":5,"target":6},
      {"source":8,"target":5},
      {"source":0,"target":8},
      {"source":6,"target":8},
      {"source":7,"target":8}
    ],
  "constraints":[
    {"type":"alignment",
     "axis":"x",
     "offsets":[
       {"node":0, "offset":0},
       {"node":1, "offset":250},
       {"node":8, "offset":125}
     ]},
    {"type":"alignment",
     "axis":"y",
     "offsets":[
       {"node":0, "offset":0},
       {"node":1, "offset":0},
       {"node":8, "offset":-450}
     ]}
  ]
}

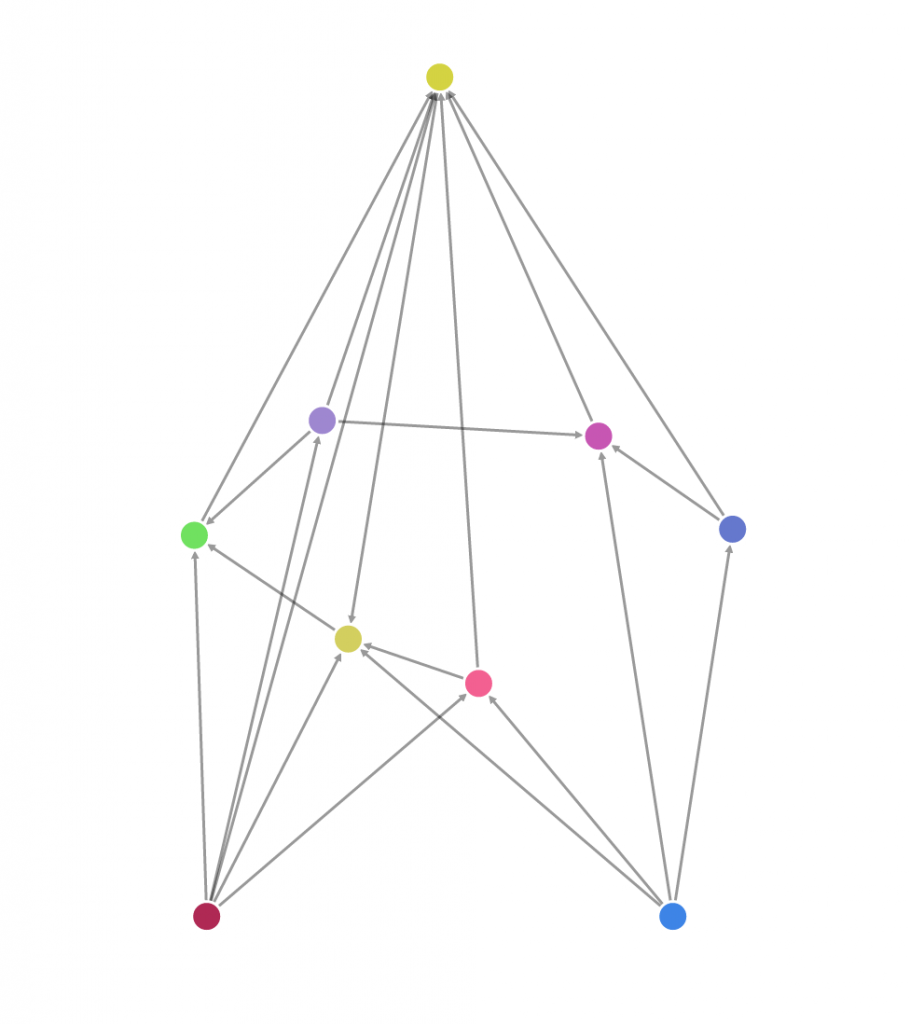
In this graph, I was able to lock the positions of the input and output nodes at the bottom and top respectively, while relying on cola.js to place the hidden nodes where it wants.  The actual code is a bit messy and I am not too familiar with d3, so I will need to write a wrapper to use this with a NEAT implementation.

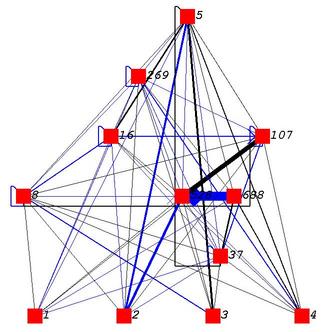
This will look much cooler than typical NEAT graphs seen on the web (courtesy of NEAT page):

original_neat